
システム開発部の @nukisashineko (ぬさし) です。
記事の対象者
aws cloudwatch logs insight に興味がある人。
aws ドキュメントの色々な要素を複合した query の作例を見てみたい人。
やりたいこと
aws cloudwatch log に apache access_log を流しています。
すごくざっくりとアクセス解析をしたくなったので、
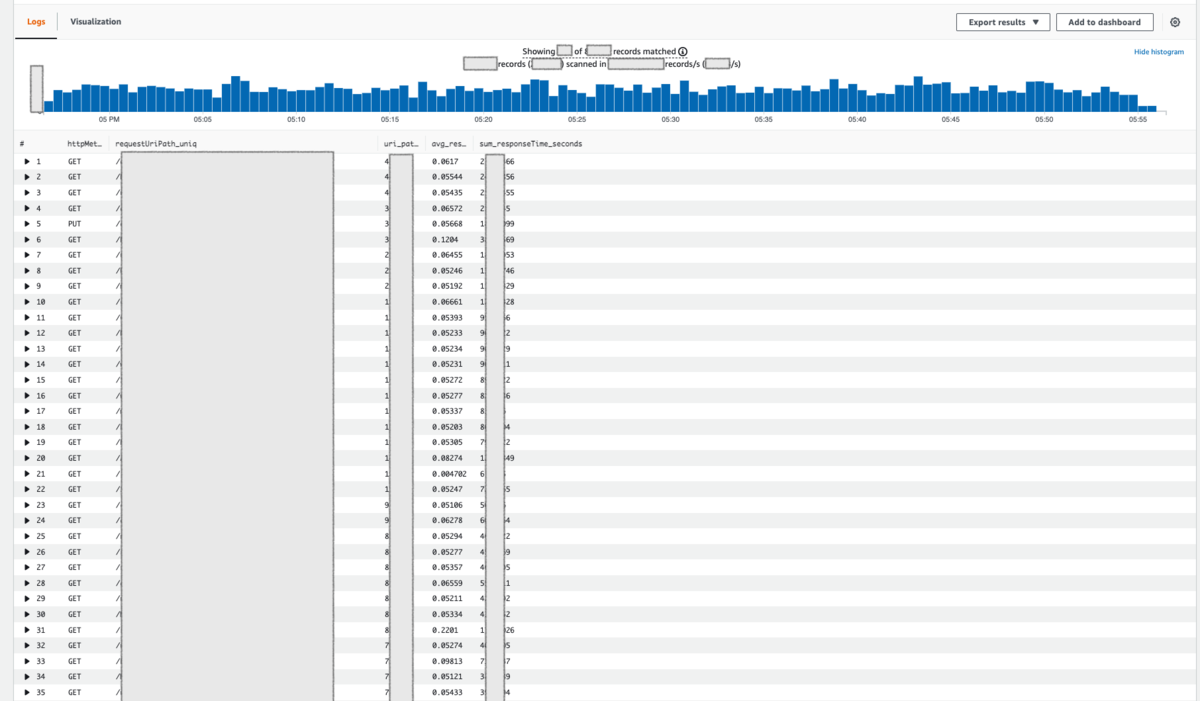
insight の query を書いて簡素なアクセス解析を行いました。
やりたいことは下記です。
- 簡素なアクセス数のカウント
- 数字列は
*へ変換 - URL の Get parameter を無視
- Bot や 死活監視は対象外とする
- 数字列は
apache の log format
LogFormat "%v %{X-Forwarded-For}i %l %u %t \"%r\" %>s %b \"%{Referer}i\" \"%{User-Agent}i\" %D" combinedvh
cloudwatch log insights query
# 注意: 検索時の指定時間を無制限にするとお金がかかるので、1日以下で区切って利用すること
# 説明:
#    - "指定時間帯における URI Path (Get query parameters を含まない) ごとの成功済みアクセス数を 数字部分unique して取得するためのクエリ"
#        - 利用されている api や path の判定で、棚卸しの際に利用する
#            - 複数のサービスが一台に乗っている場合の filter を "コメントアウト設定" で追加
#            - aws の health check へのアクセスを排除
#            - bot 系の UA を排除
#            - 重複 slash 部分を "/" のようにまとめるために置換処理を行っている
#            - 数字部分を "/xxxxxx/*/yyyy/" のように アスタリスクにまとめるために置換処理を行っている
#            - ※ トレイリングスラッシュ有無の重複削除の考慮は現状未実装
#        - アクセス数 (uri_path_count), 平均レスポンス秒数(avg_responseTime_seconds), 合計レスポンス秒数(sum_responseTime_seconds) を一緒に吐き出す

fields @timestamp, @message
| parse @message /\s*(?<srcIpAddress>.*?)\s+(?<srcUser>.*?)\s+(?<remoteUser>.*?)\s+\[(?<timestamp>.*?)\]\s+"(?<httpMethod>.*?)\s+(?<requestUriPath>[^\?]*?)(?<requestUriParameters>\?.+?)?\s+(?<protocol>.*?)"\s+(?<statusCode>.*?)\s+(?<transferredData>.*?)\s+"(?<referer>.*?)"\s+"(?<userAgent>.*?)"\s+(?<responseTime>.*)\s*/
# 複数のサービスがVirtual Host 等で一台に載ってる場合は下記で srcIpAddress を指定
# -------------------- ここから ------------------------------
#| filter srcIpAddress like /^search_your_service_domain/
# -------------------- ここまで ------------------------------
| filter statusCode = 200
| filter userAgent not like /(?:Googlebot|bingbot|GoogleStackdriverMonitoring-UptimeChecks|Zabbix|SemrushBot|Linespider|Amazonbot|GoogleDocs|Applebot|AhrefsBot|trendictionbot|ICC-Crawler|Hatena::Russia::Crawler)/
| filter srcIpAddress not like /^ip-\d+-\d+-\d+-\d+-\d+.ap-northeast-1.compute.internal/
| fields replace(replace(requestUriPath, '///', '/'), '//', '/') as requestUriPath_removed_double_slash
| fields replace(replace(replace(replace(replace(replace(replace(replace(replace(replace(requestUriPath_removed_double_slash, '0', '*'), '1', '*'), '2', '*'), '3', '*'), '4', '*'), '5', '*'), '6', '*'), '7', '*'), '8', '*'), '9', '*') as requestUriPath_asterisk_array
| fields replace(replace(replace(replace(replace(replace(replace(replace(replace(replace(requestUriPath_asterisk_array, '***********', '*'), '**********', '*'), '*********', '*'), '********', '*'), '*******', '*'), '******', '*'), '*****', '*'), '****', '*'), '***', '*'), '**', '*') as requestUriPath_uniq
| stats count(*) as uri_path_count, (avg(responseTime)/1000000.0) as avg_responseTime_seconds , (sum(responseTime)/1000000.0) as sum_responseTime_seconds  by httpMethod,requestUriPath_uniq
| sort by uri_path_count desc
| limit 10000
まとめ
この query を利用するサービスでは url 内の id が数字列であることが前提だったので、数字列を置換するだけで簡単にアクセス数の数え上げを行えました。
多分、id が文字列だとちゃんとしたログ解析ツールを利用したほうが早いと思います。
( replace 関数が正規表現に対応していないため )
簡素なログ解析として alp コマンドや athena 等の利用の利用をせず、 cloudwatch log insight だけでサービス内のアクセスを調べることができるということがわかりました。
ニッチな需要だと思いますが、Apache + cloudwatch logs を利用の方はクエリをお試し下さい。